Dashboard
The Dashboard is your main starting page after sign-in. It helps you quickly see what matters, move to the right module, and continue your work without extra steps.
Choose the tab below that matches your real ArkBox role to see your navigation choices:
- Arkbox User
- Arkbox Admin
The visible tabs depend on your permissions.
| Navigation Item | Purpose |
|---|---|
| Dashboard | Opens the main overview page. |
| Resources | Opens My Library (requires resource access permission). |
| Project Management | Opens assigned Projects and Reports (requires project membership). |
| ArkBox Vault | Opens assigned vault shares (requires vault sharing access). |
Dashboard Widget Visibility by Role
The cards and metrics displayed on your dashboard adapt dynamically based on your account role:
| Dashboard Card / Widget | Description | Visible to User | Visible to Admin | Access / Permission Requirement |
|---|---|---|---|---|
| User Identity Card | Quick reference panel showing user details, email, account type, and last login. | Yes | Yes | None (Visible to all logged-in users) |
| Welcome Banner | Top banner welcoming the user and showing the current landing context. | Yes | Yes | None (Visible to all logged-in users) |
| Project Snapshot | Summarizes active project status, progress, and critical overdue counts. | Yes | Yes | Requires assignment to at least one active project |
| Resources Summary | Displays counts of available and downloaded vault/library resource files. | Yes | Yes | Requires access to the Resource Library |
| System Resource Monitoring | Real-time charts showing CPU and Memory usage on the host server. | No | Yes | Restricted to System Administrators |
What The Dashboard Is For
Use the Dashboard to:
- Start from a single overview page after login.
- Move quickly to major ArkBox modules.
- Check current attendance status.
- Monitor running tasks, such as uploads or backups.
- Access profile identity and logout actions.
Top Navigation

Top Navigation Bar
Check-In Workflow
- Sign in to ArkBox.
- Find Check In in the top header.
- Select Check In when you begin work.
- Confirm that the timer or status changes.
- Select Check Out when you finish.
Some project actions may require users to be checked in before status updates are allowed.
The Check In button's availability and working state depend on the leave policy configured for your account:
- Leave Policy Required: The Check In button is only enabled when you have a resolved leave policy. If no policy is configured, the button is disabled with a popup message indicating that attendance is not configured.
- Where to Configure Leave Policies:
- Project-Specific Policy (Project Level): Configured by a Project Administrator when creating or editing a project under Project Management > Project Administration > Leave Policy. If you are assigned to a project with a policy, it will override the default global policy.
- Default Global Policy (Global Level): Configured by a System Administrator under Admin Settings > Attendance Settings > Default Leave Policy (accessed via the Settings button in the Attendance Report). This serves as the fallback policy if no project-specific policy applies to you.
- Working Shifts & Auto-Checkout: The resolved policy defines your daily working shift schedule, and automatically checks you out at the end of the shift (plus any grace/warning period).
Task Notifications
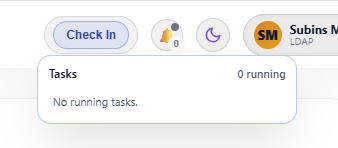
Task Notifications
The task indicator helps users track long-running work.
- Upload tasks appear while files are being transferred.
- Download tasks appear while larger resource or vault downloads are running.
- Backup tasks appear while a backup job is running.
- The count shows how many tasks are active.
- Selecting a backup task can open more details about that run.
UI Theme Toggle (Dark / Light)

UI Theme Toggle (Dark / Light)
The Moon icon in the top-right bar is the appearance control for the entire Arkbox interface. It lets you switch between Light Mode and Dark Mode instantly, without reloading the page or interrupting your session.
How It Works
- Click the Moon icon once.
- The interface switches theme immediately.
- Your preference is remembered for future sessions.
- Click again to toggle back.
Profile Section — User & Environment Indicator
At the top-right of the dashboard, the circular avatar with user initials and an environment label (e.g., Local) is your active profile control.
This small area serves three purposes at once:
Identity badge + user name + environment status
What the Profile Display Communicates
From the profile chip alone, you can tell:
| Item | Meaning |
|---|---|
| Initials (avatar) | Logged-in user indicator |
| User name | Active account identity |
| Environment label (e.g., Local) | Where you are currently operating (Local vs LDAP) |
This prevents confusion about who is logged in and which environment is active.
Logout
Logout Button
The Logout option in the top-right corner safely ends your current Arkbox session and returns you to the login screen.
It securely ends your current session.
What Happens When You Click Logout
- Your authenticated session ends.
- Your local session token is cleared.
- You are redirected to the Arkbox login page.
- You can no longer access any module without logging in again.
Welcome Banner
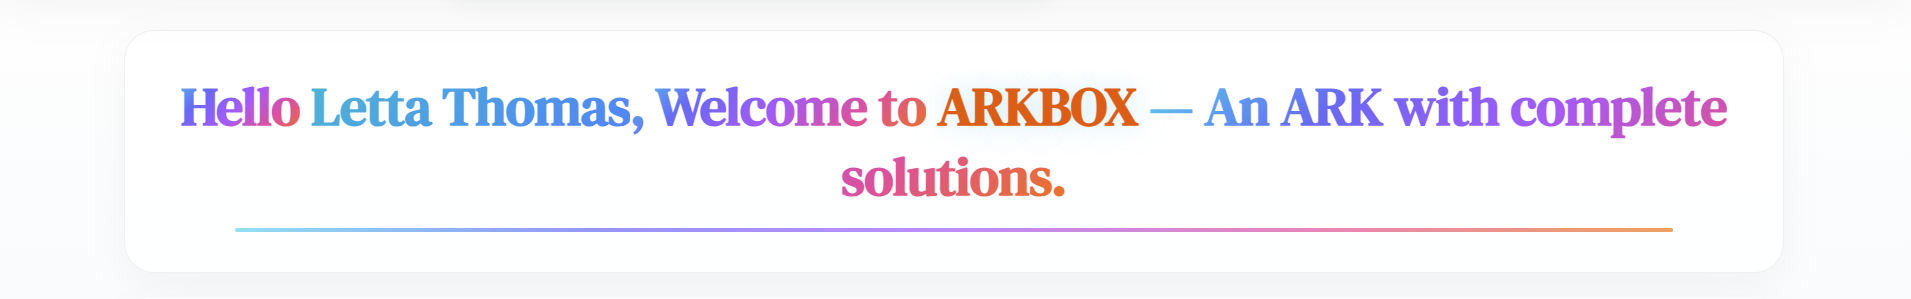
Welcome Banner
The Welcome Banner appears prominently near the top of the Dashboard after login. It is the first visual confirmation that you have successfully entered Arkbox.
Purpose of the Welcome Banner
This banner is not decorative. It serves three functional roles:
| Role | What it Confirms |
|---|---|
| Login success | You are authenticated and inside the system |
| Correct landing page | You are on the Dashboard (home screen) |
| System identity | Arkbox branding and environment context |
User Identity Card
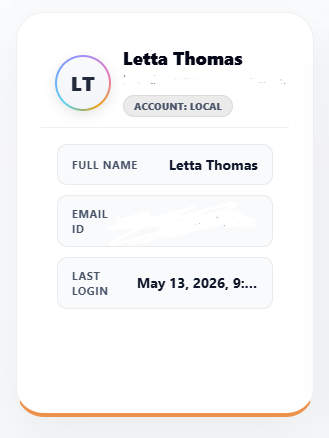
User Identity Card
On the left side of the Dashboard, a vertical card displays key details about the currently logged-in user. This is the User Identity Card.
It acts as a quick reference panel for identity and account context.
Purpose of the User Identity Card
This panel helps you immediately confirm:
| Item Shown | What It Means |
|---|---|
| User name | Who is currently logged in |
| Email ID | Account used for login |
| Account type / Environment (e.g., Local) | Where are you operating from |
| Last login date | Most recent access time |
Resources Summary
Resources Summary
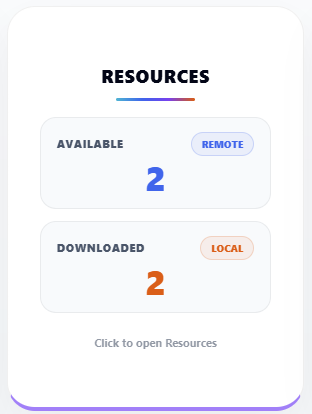
On the right side of the Dashboard, the Resources Summary panel gives you a quick count of the resources available in your ArkBox environment.
It helps you understand what is already available and what has already been downloaded.
What This Panel Displays
Typical entries you’ll see:
| Section | Meaning |
|---|---|
| Available | Total resources currently available to your server |
| Downloaded | Total available resources that have already been downloaded and are available in ArkBox Vault |
This gives you a simple overview of what is available right now.
How it Works
- Check Available to understand how many resources are currently available to your server.
- Check Downloaded to see how many of those resources are already downloaded and ready to use.
- Open the related ArkBox area when you want to use those resources.
Project Snapshot
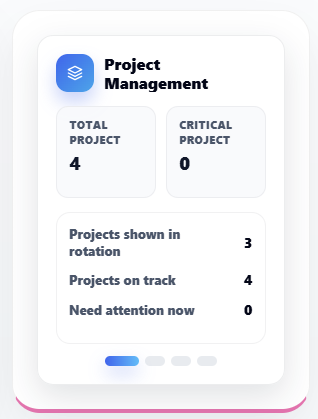
Project Snapshot
On the right side of the Dashboard, the Project Snapshot appears as a card summarising the current or most relevant project assigned to you.
It is your entry point into active work.
What the Project Snapshot Shows
This card typically includes:
| Item | Meaning |
|---|---|
| Project name | Title of the project |
| Total Projects | Count of projects assigned to you |
| Critical Projects | Projects that are overdue or not running on time |
| Project type | Nature of the work (e.g., translation, media, data) |
| Status / Progress % | How much work is completed |
| Open / Closed | Current state of the project |
Why This Card Is on the Dashboard
Instead of navigating into Project Management to find your work, Arkbox surfaces the most relevant project here so you can:
Start working with one click.
It helps reduce the steps between login and action.
What Happens When You Click the Card
Clicking the snapshot takes you directly into:
- The project workspace
- Files and folders related to the project
- Tasks, resources, and progress tracking
How Users Read This Card
| Indicator | What You Learn Instantly |
|---|---|
| Progress % | How far has the project moved |
| Critical count | Whether urgent attention is needed |
| Type | What kind of tools/resources do you need |
Live Project Awareness
As the project progresses, this card updates to reflect:
- New progress
- Priority changes
- Status updates
So the dashboard always reflects current reality.
System Resource Monitoring
This widget is restricted to System Administrators. Regular users will not see these meters.
System Resource Monitoring
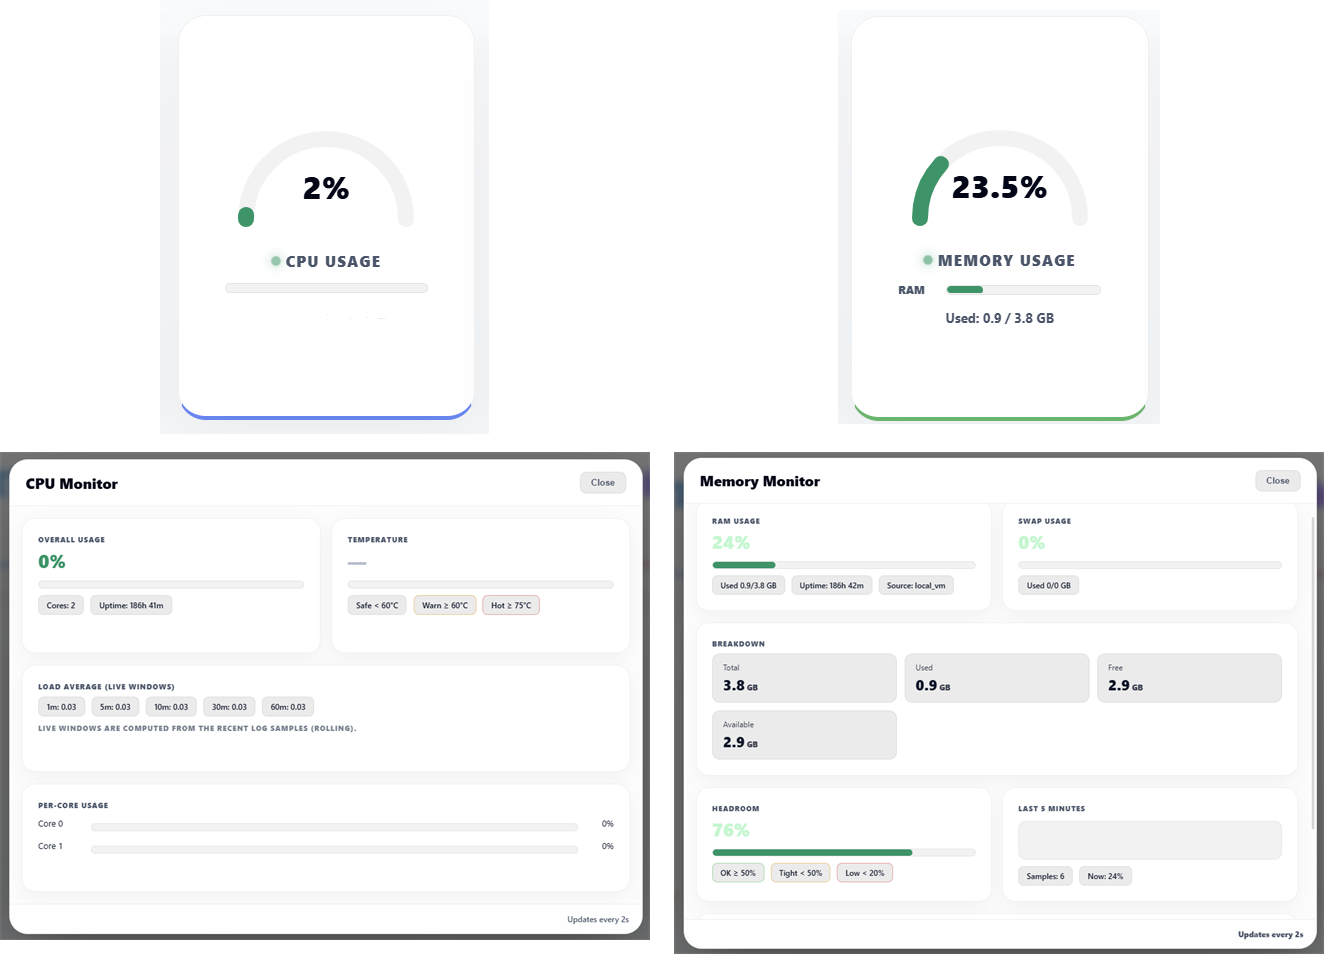
The System Resource Monitoring area shows the current CPU and Memory usage for the environment assigned to you.
What you see depends on your ArkBox setup:
- In a Local deployment, it can show the status of the physical machine that is running ArkBox.
- It can also show the ArkBox Local container usage where ArkBox is installed.
- In SaaS, the CPU and Memory values are shown for the virtual server assigned to the user.
For physical machines, CPU details can include temperature.
For virtual environments, instead of temperature, ArkBox can show Steal Time, which helps indicate when the virtual machine is waiting on shared CPU resources.
From Admin Settings, the monitoring source can be configured:
- For SaaS, only Local is available.
- For non-SaaS, Local, Host Agent, or Both can be available.
What These Widgets Show
CPU Usage
- Shows how much processor capacity is currently being used.
- Helps you understand whether the system is lightly loaded or busy.
Memory Usage
- Shows how much memory is currently in use compared with the total memory available.
- Usually shown as used amount, total amount, and percentage used.
These values update while the system is running.
What The Detail View Explains
When you open the CPU or Memory details, ArkBox shows how the values are calculated in a more detailed way.
CPU Detail
- Overall Usage shows the current total CPU usage as a percentage.
- Load Average shows how busy the system has been over time windows such as 1 minute, 5 minutes, and 15 minutes.
- Per Core Usage shows how much work each CPU core is handling.
- Temperature is shown when the source is a physical host that reports sensor data.
- Steal Time is shown in virtual environments to indicate how much time the VM had to wait for CPU access.
Memory Detail
- RAM Usage shows the percentage of memory currently in use.
- Used / Total shows how much memory is being used out of the total available.
- Free shows memory not currently in use.
- Available shows memory that can still be used by applications.
- Cached, Buffers, and Slab help describe how the operating system is using memory for faster performance.
- Swap Usage shows whether temporary disk-based memory is being used.
- Headroom shows how much memory capacity is still available before the system becomes tight on memory.
Why These Widgets Matter
These widgets help users:
- Understand current system health
- Notice when CPU or memory usage is unusually high
- Understand whether the environment is stable
How Users Should Read These Meters
| Reading | Meaning | Action |
|---|---|---|
| Low CPU & RAM | System healthy | Continue working |
| High CPU | System is busy | Wait for activity to settle if needed |
| High RAM | Memory is filling up | Review running work and reduce load if required |