General Settings
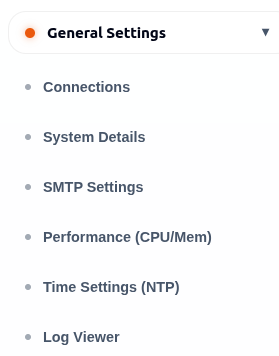
General Settings control system-wide behavior for connections, email, monitoring, time, and logs.
Pages In This Section
| Page | Purpose |
|---|---|
| Connections | Configure the default RemoteOps connection server URL. |
| SMTP Settings | Configure outgoing email. |
| Performance (CPU/Mem) | Configure system monitoring and usage logging. |
| Time Settings (NTP) | Configure timezone and time synchronization. |
| Log Viewer | Review system activity and audit events. |
Connections
The Connections page stores the default server URL used when creating RemoteOps connections. The configured URL is stored in the system database and is used when creating new RemoteOps connections. Changes take effect for future RemoteOps connection creation workflows.
- Open General Settings.
- Select Connections.
- Enter the RemoteOps connection server URL.
- Save Connections.
After saving, a confirmation message is displayed when the connection URL is updated successfully. Use a valid, reachable URL. If the URL is incorrect, new remote connection setup may fail.
SMTP Settings
SMTP Settings configure the outgoing email server used by ArkBox for notifications, alerts, report delivery, and password reset emails when enabled.
| Field | Purpose |
|---|---|
| SMTP Host | Email server address. |
| Port | Email server port. |
| Encryption | Security mode such as STARTTLS. |
| Username and Password | Email server credentials. |
| From Name and Email | Sender identity shown to recipients. |
The page also provides a Send Test Email section that allows users to verify SMTP connectivity and email delivery.
Configure SMTP
- Open SMTP Settings.
- Enter the email server details.
- Save Settings.
- Enter a test recipient.
- Send a test email.
- Confirm the email arrives.
A confirmation message is displayed after SMTP settings are saved successfully. When a test email is triggered successfully, a confirmation message is displayed prompting the user to check the recipient inbox.
Performance Monitoring
Performance Monitoring collects CPU and Memory usage information from the local system.
CPU Monitoring and Memory Monitoring are configured separately.
Both sections display:
- Monitoring Source
- Usage Logging
- Log Retention (Days)
The monitoring source shown in the interface is Local.
Usage logging records performance data over time for diagnostics, historical review, and capacity planning.
Time Settings
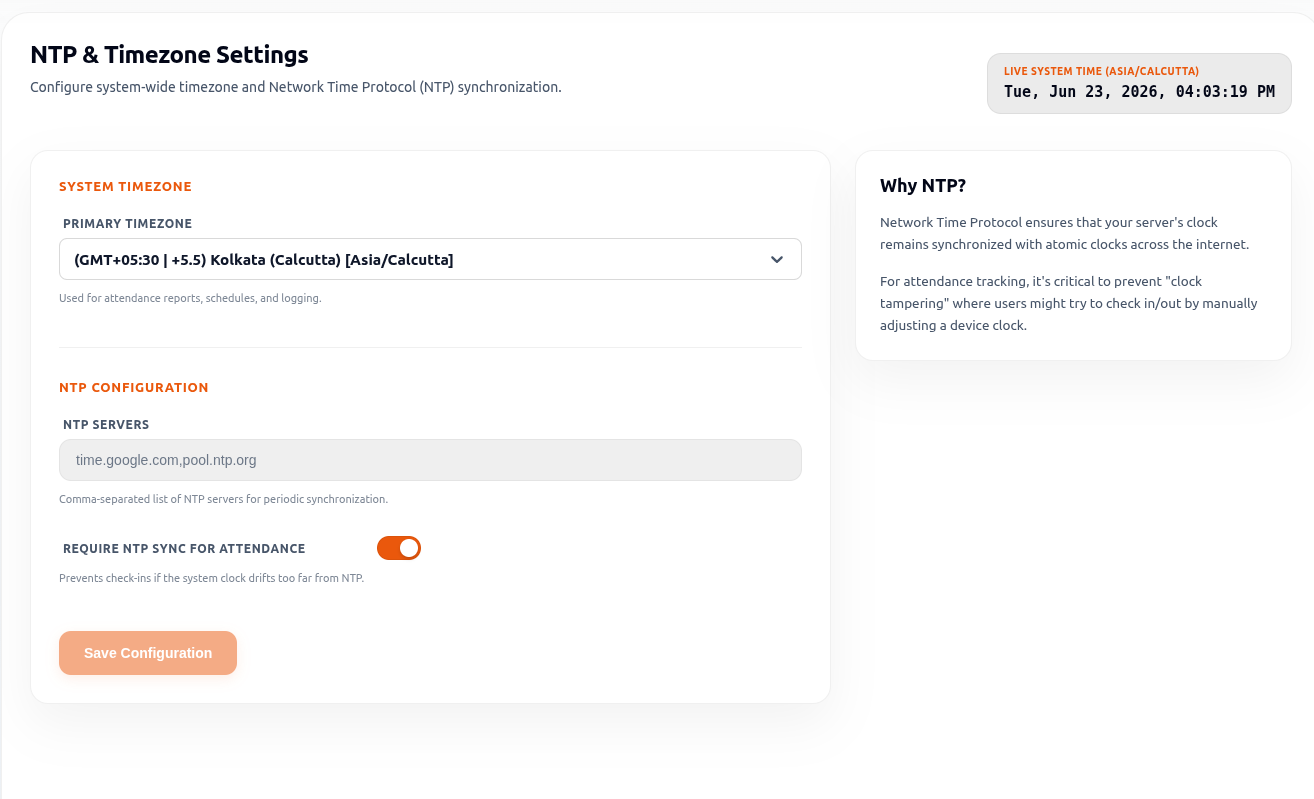
Time Settings keep ArkBox time accurate across logs, schedules, attendance, and reporting.
The page displays the current live system time based on the selected timezone.
Time Settings include:
- Primary Timezone
- NTP Servers
- Require NTP Sync For Attendance
- Live System Time
- Open Time Settings (NTP).
- Select the system timezone.
- Add NTP servers, such as
time.google.com. - Enable NTP sync requirement for attendance if required.
- Save Configuration.
When the system timezone is changed, the displayed live system time is updated according to the selected timezone.
A confirmation message is displayed after the configuration is saved successfully.
Log Viewer
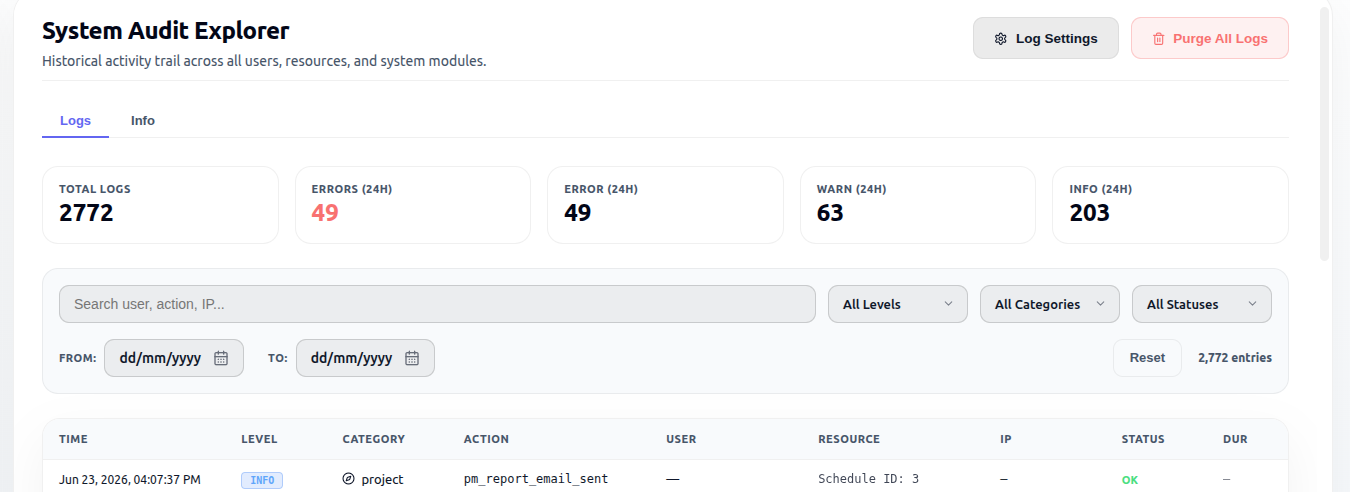
The Log Viewer is the system audit explorer. The Log Viewer provides a historical activity trail across users, resources, and system modules. It helps administrators review system activity, troubleshoot issues, and track user actions.
Summary Information
The summary section displays key log statistics:
| Item | Description |
|---|---|
| Total Logs | Total number of available log records. |
| Errors (24H) | Number of error events recorded during the last 24 hours. |
| Error (24H) | Error-related log count for the last 24 hours. |
| Warn (24H) | Warning events recorded during the last 24 hours. |
| Info (24H) | Informational events recorded during the last 24 hours. |
These values provide a quick overview of recent system activity. Use filters to narrow logs by search text, log level, category, status, and date range.
Filter Logs
Use the available filters to locate specific log entries.
Available filters include:
- Search
- Level
- Category
- Status
- From Date
- To Date
The Reset button clears the active filters and returns the full log list.
Log Levels
The Level filter allows logs to be filtered by severity.
Available levels include:
- ERROR
- WARN
- INFO
- DEBUG
Categories
The Category filter allows logs to be filtered by module or feature area.
Available categories include:
- AUTH
- SHARE
- AGENT
- USER
- SYSTEM
- FILE
- API
- PROJECT
Log Details
The log table displays detailed information for each log entry.
Available columns include:
| Column | Description |
|---|---|
| Time | Date and time when the event occurred. |
| Level | Severity level of the log entry. |
| Category | Module or feature area that generated the log. |
| Action | Action or event that occurred. |
| User | User associated with the event. |
| Resource | Related system resource. |
| IP | IP address associated with the event. |
| Status | Result of the action. |
| Dur | Duration information when available. |
Tabs
The Log Viewer includes the following tabs:
| Tab | Purpose |
|---|---|
| Logs | Displays audit and activity records. |
| Info | Displays informational log data. |
When filters do not match any records, the log table displays a "No matches found" message.
The bottom of the page displays record counts and navigation controls for moving between log pages when multiple records are available.
Actions
The Log Viewer provides the following actions:
| Action | Purpose |
|---|---|
| Log Settings | Opens log configuration settings. |
| Purge All Logs | Removes existing log records. |
Tracing Automated Report Generation
For troubleshooting automated Project Management Schedule Reports, the Log Viewer tracks background report queue runs:
- Queue ID Tracking: Every report generation job is tracked with a unique Queue ID recorded in the system audit logs.
- Process Status: Logs indicate whether the generation was a success or failure.
- Failure Reason Logging: If a report fails to generate or deliver, the specific error or failure details are attached to the log entry.
- How to Search: To find these logs, filter by the PROJECT or SYSTEM category, or search for terms like "Report", "User", or a specific Terms in the search filter.
Good Practices
- Test email settings before enabling scheduled report delivery.
- Keep the system timezone aligned with organizational reporting needs.
- Use NTP sync when attendance accuracy matters.
- Use Log Viewer before making assumptions about user or system activity.
- Verify SMTP settings using Send Test Email before relying on automated email delivery.
- Review log retention settings to ensure sufficient monitoring history is maintained.
- Confirm the selected timezone before configuring attendance schedules and reports.
- Use reachable NTP servers to maintain accurate system time.